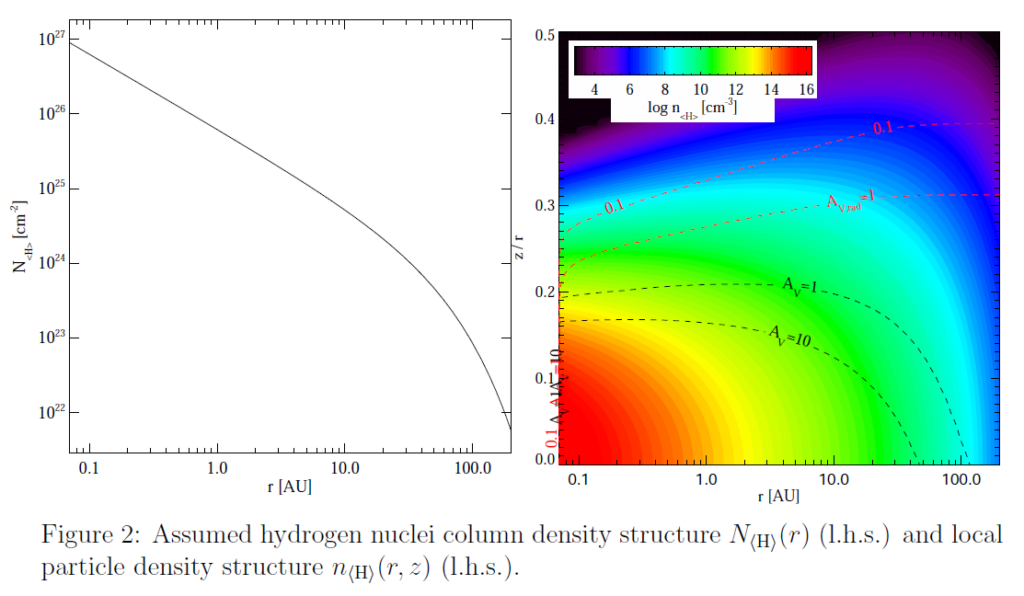
The density setup is parametric in this model, see Fig. 2, i.e. the disc shape is fixed by
powerlaws for the column density and scale height as function of radius. However, we
use a modified powerlaw here, with exponential tapering off, for the column density as

which can naturally explain the often somewhat larger spectral appearance of the disc in (sub-)mm molecular lines, because the lines remain optically thick even at large radii where the continuum is already optically thin and vanishes in the background.
The quite tall inner disc, and a very modest increase of the height z where the radial Aν reaches 1 and 0.1 (as function of radius, see red dashed lines in Fig. 2) are key to produce the desired SED features (Fig. 1). The tall inner disc is needed to intercept enough star light to re-radiate it as prominent near-IR excess, and the very modest “disc flaring” produces the desired SED-slope around 100 μm. In contrast, hydrostatic disc models have very thin inner discs, and strongly flaring outer discs.
Dust settling is included according to Dubrule et al. (1995), assuming an equilibrium between upward turbulent mixing and downward gravitational settling. This results in a size-dependent reduction of the dust scale-heights H(r, a) with respect to the gas scale-height H(r), dependent on turbulent mixing parameter α, as

where Ω is the Keplerian orbital frequency, γ ≈ 2 and τf = (ρd a)/(ρ cS) is the frictional timescale, ρd is the dust material density, ρ is the midplane gas density, and cS is the midplane sound speed.
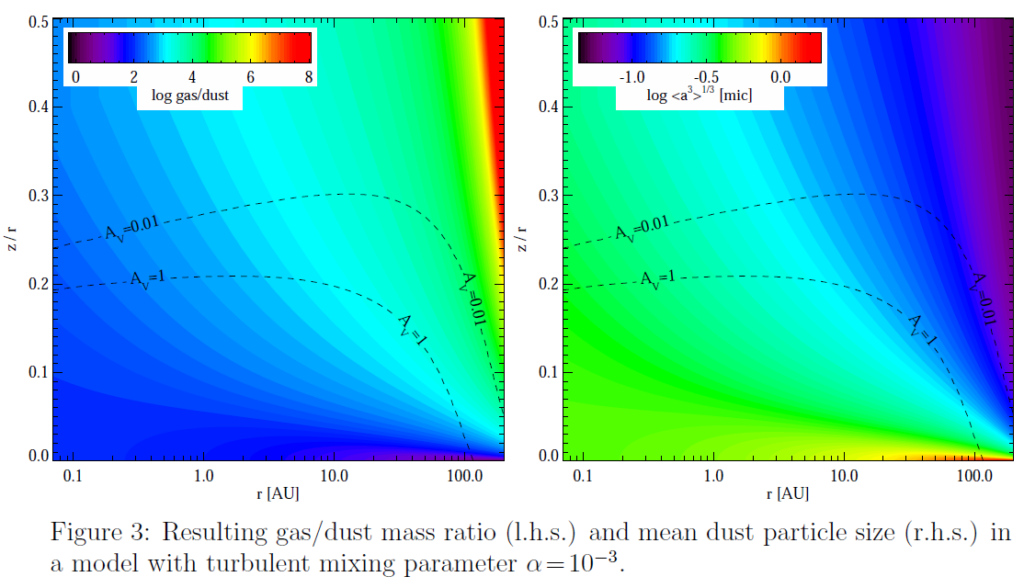
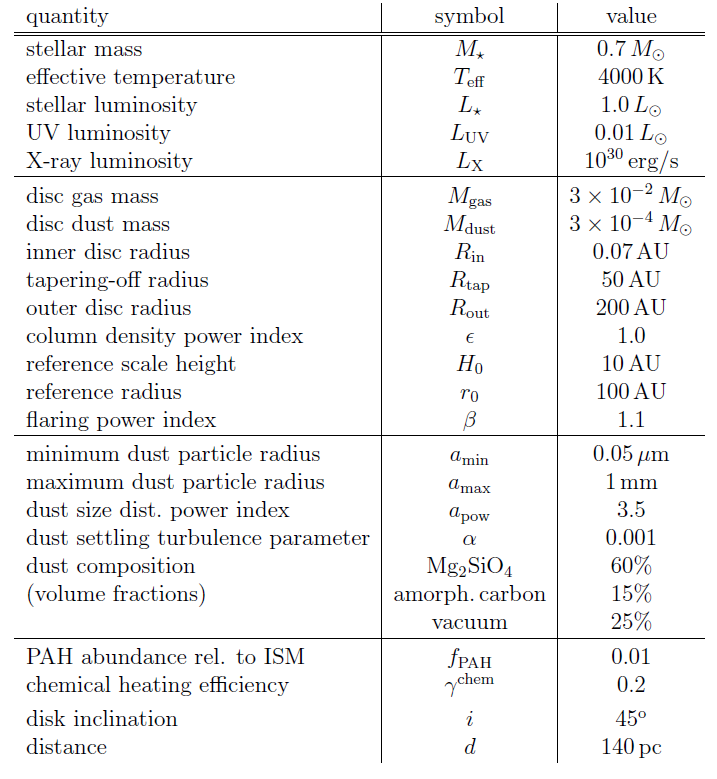
The resulting local dust/gas mass ratios and mean dust particle sizes ⟨ a ⟩ are shown in Fig. 3. Note that the dust settling according to (Dubrulle et al. 1995) is density-dependent, and so the effects on local dust/gas and size distribution are much more pronounced in the tenuous outer layers. The regions important for line emission (roughly Aν ≈ 0.01…1) can easily have gas/dust ratios that are larger by several orders of magnitude as compared to the overall (volume integrated) gas/dust ratio, here assumed to be 100. The following table summarizes the parameters of the model:
Return to:
1. Spectral Energy Distribution
Go on with:
3. Gas and Dust Temperatures
4. Chemical Structure
5. Predicted Continuum Observations
6. Predicted Line Observations