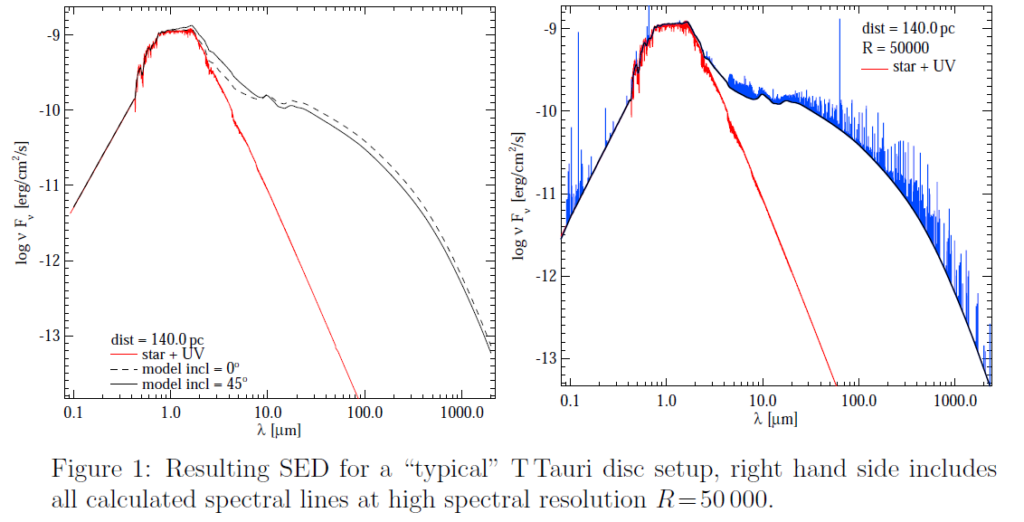
The calculated spectral energy distribution (SED), see Fig. 1, is featured by
- a powerlaw UV stellar input spectrum, to roughly account for the UV-excess of TTauri stars, which intersects the photospheric input spectrum at about 430 nm in this model and results in a total UV luminosity of 0.01 L☉ (91.2 to 250 nm),
- an X-ray input spectrum (not shown), emitted from the position of the central star, with a total X-ray luminosity of 1×10+30 erg/s with an X-ray emission temperature of 2×10+7 K,
- strong near-IR excess (2 to 7 μm) of about 0.1 L☉,
- clearly visible silicate dust emission features around 10 and 20 μm,
- a descending SED-slope beyond 20 μm, as is typical for continuous (non-transitional) TTauri discs,
- a 1.3 mm flux of about 100 mJy at 140 pc, and
- a mm-slope of β = − log(Fν)/log(λ) − 2 ≈ 0.3.
Go on with:
2. Disc Shape and Dust Settling
3. Gas and Dust Temperatures
4. Chemical Structure
5. Predicted Continuum Observations
6. Predicted Line Observations